The bridge between raw data and real people

I build web-based data products, dashboards, and visualizations for organizations with information that has outgrown spreadsheets, static tables, and PDFs.

I like taking complicated information and making it straightforward to explore, use, and maintain.

  • Interactive web data productsFocused tools built around recurring or fragmented datasets.
  • Dashboards & reportingClear interfaces for information that no longer works as a static table or PDF.
  • Data visualizationCharts, maps, and exploratory views that make complex information easier to read.
  • Data-to-web workflowsRepeatable processing and update steps that keep products useful.

Featured Portfolio Item

Canadian Canola Market Explorer

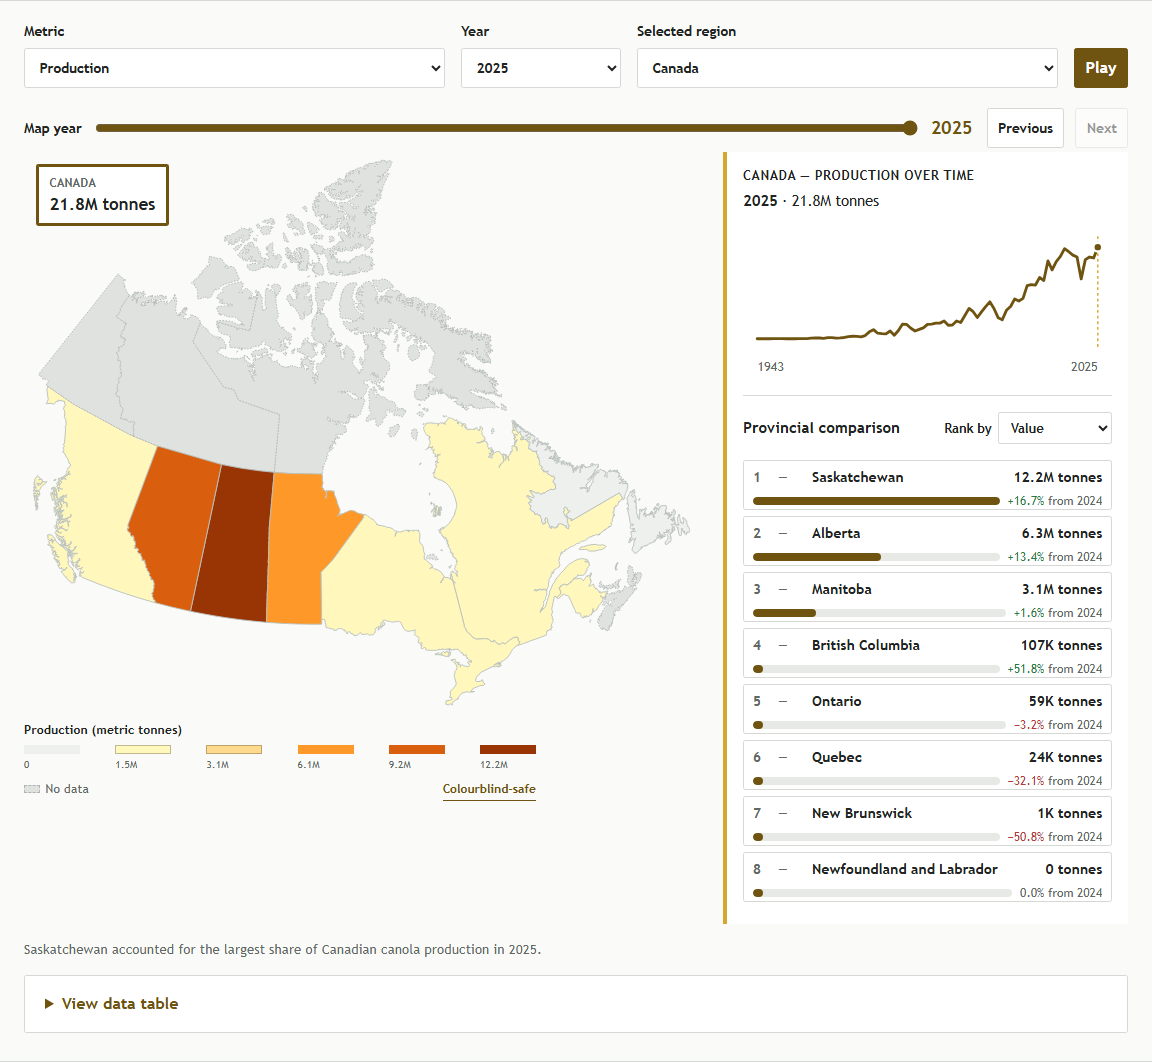
An interactive public-data product combining Canadian canola production, prices, and international trade in one responsive experience.
September 2026 · Interactive data product

The Canadian Canola Production Explorer showing filters, a production map, historical chart, and provincial comparison.

Have data that needs a better interface?

I’m open to conversations about interactive web data products, dashboards and reporting, data visualization, and related web-development work.

Contact me