Canadian Canola Market Explorer
Overview
The Canadian Canola Market Explorer is a portfolio and demonstration project that makes several dimensions of the Canadian canola market easier to understand in one place.
It brings recurring public datasets into a clear, responsive interface for people who want to explore the market without piecing together separate sources and static tables.
The challenge
Canadian canola information is available through multiple public datasets, but understanding production, prices, and trade together means moving between sources, formats, and reporting conventions.
The product needed to preserve the detail behind the data while creating a coherent path for quick questions, deeper exploration, and smaller screens.
The approach
The work treats the interface and the data pipeline as parts of the same product. That makes the experience useful now and practical to update later.
- Normalize the dataProcess recurring public datasets into consistent, application-ready formats.
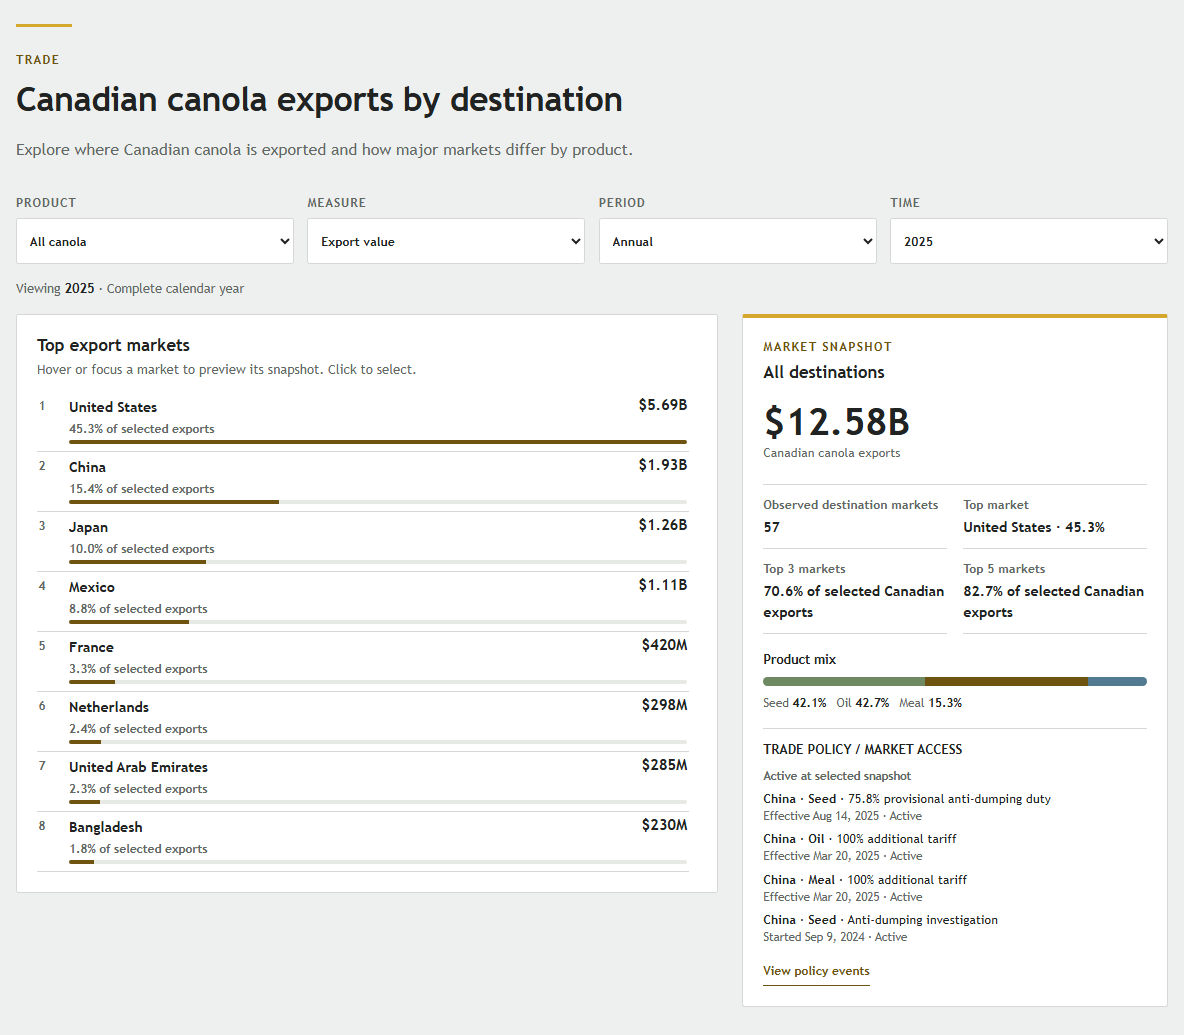
- Connect the subjectsBring Production, Prices, and Trade into one navigable experience.
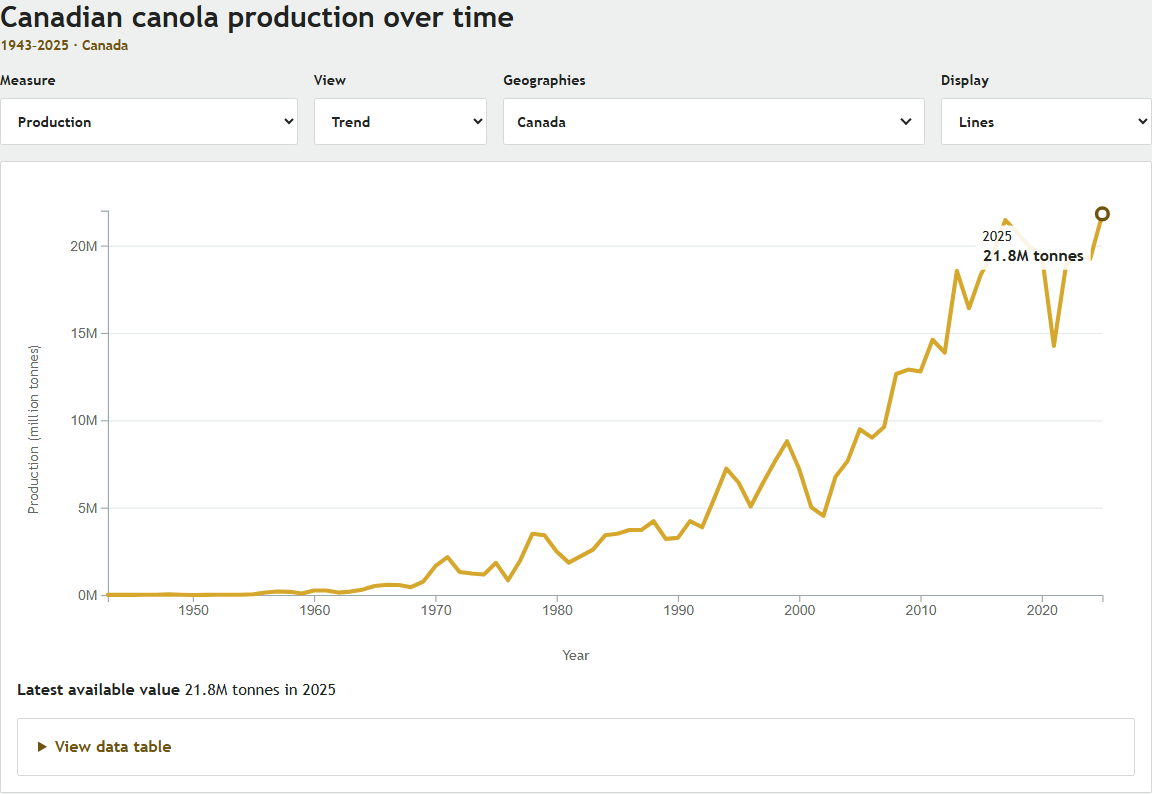
- Design for explorationUse interactive charts and maps to support comparison and discovery.
- Keep the detail availablePair visual views with accessible underlying data tables.
- Support every screenAdapt navigation, controls, and graphics for responsive use.
- Make updates repeatableDocument processing steps and source methodology for future refreshes.
The product
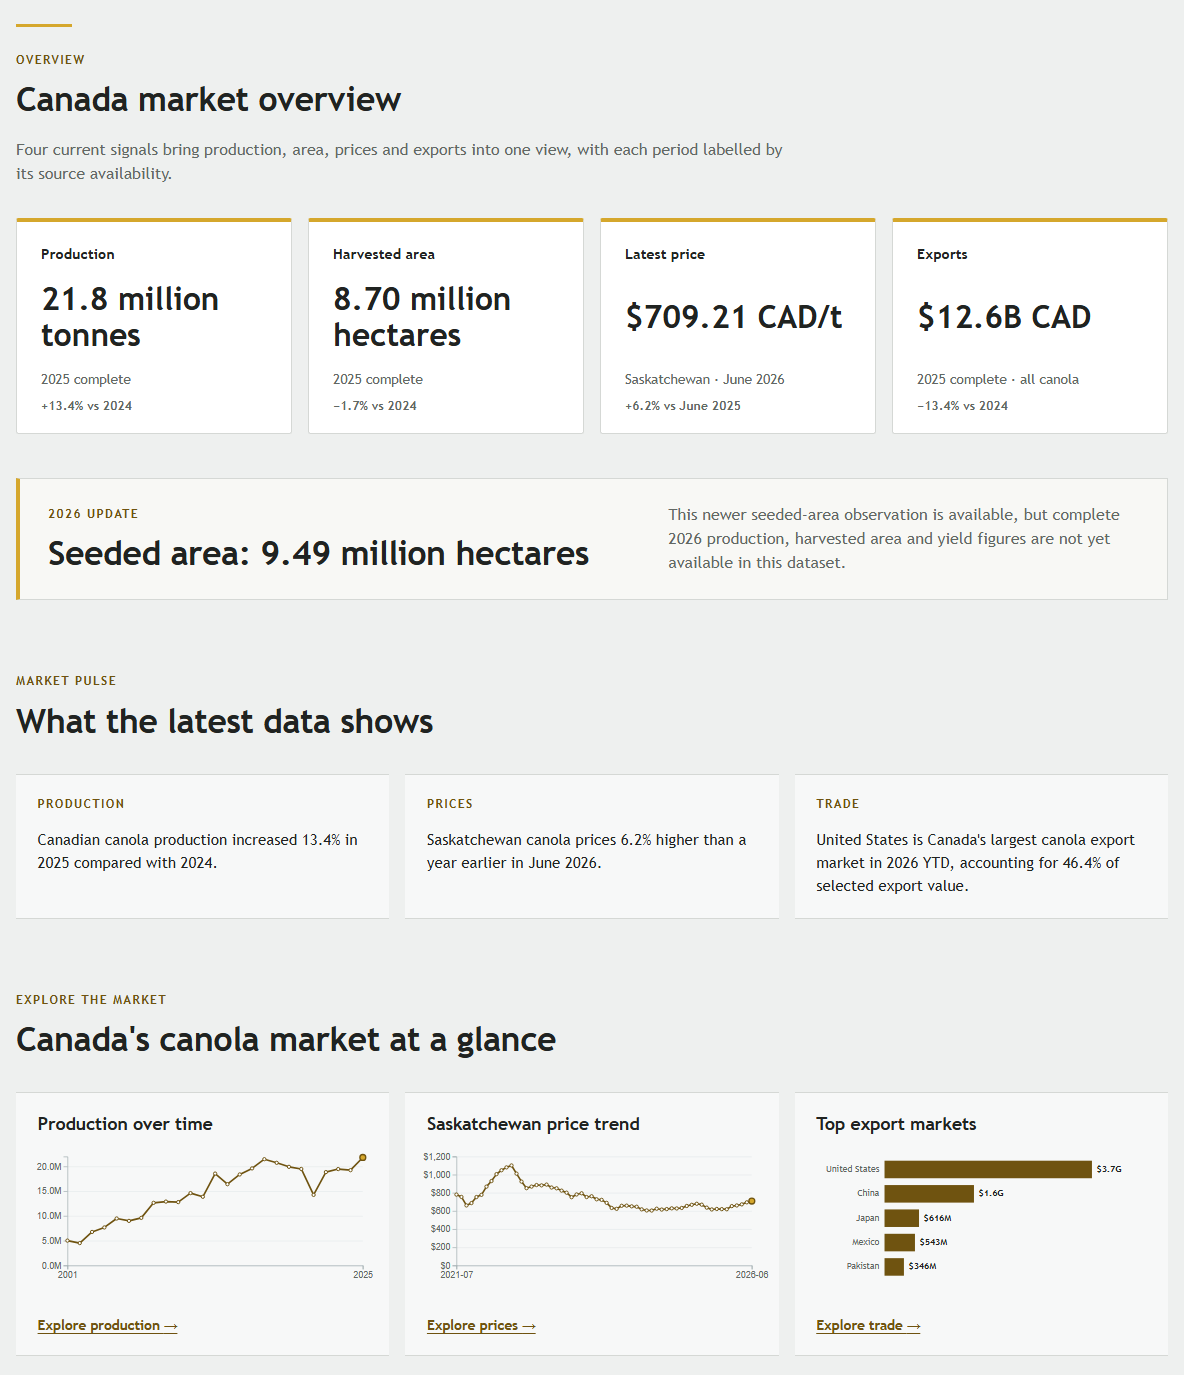
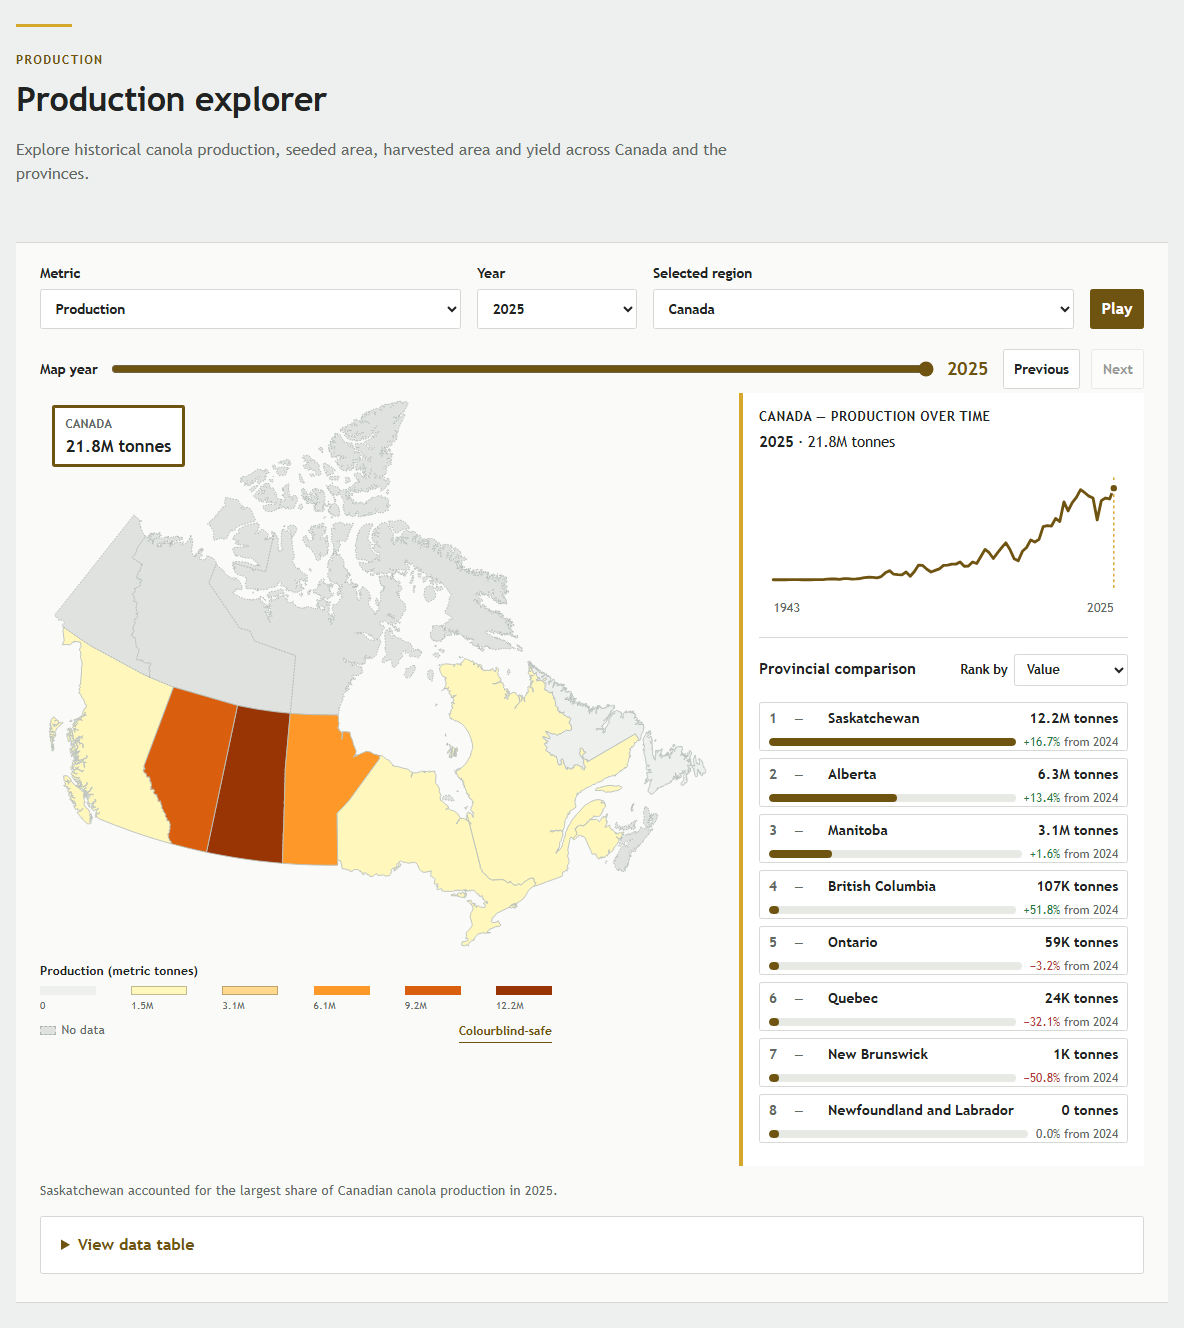
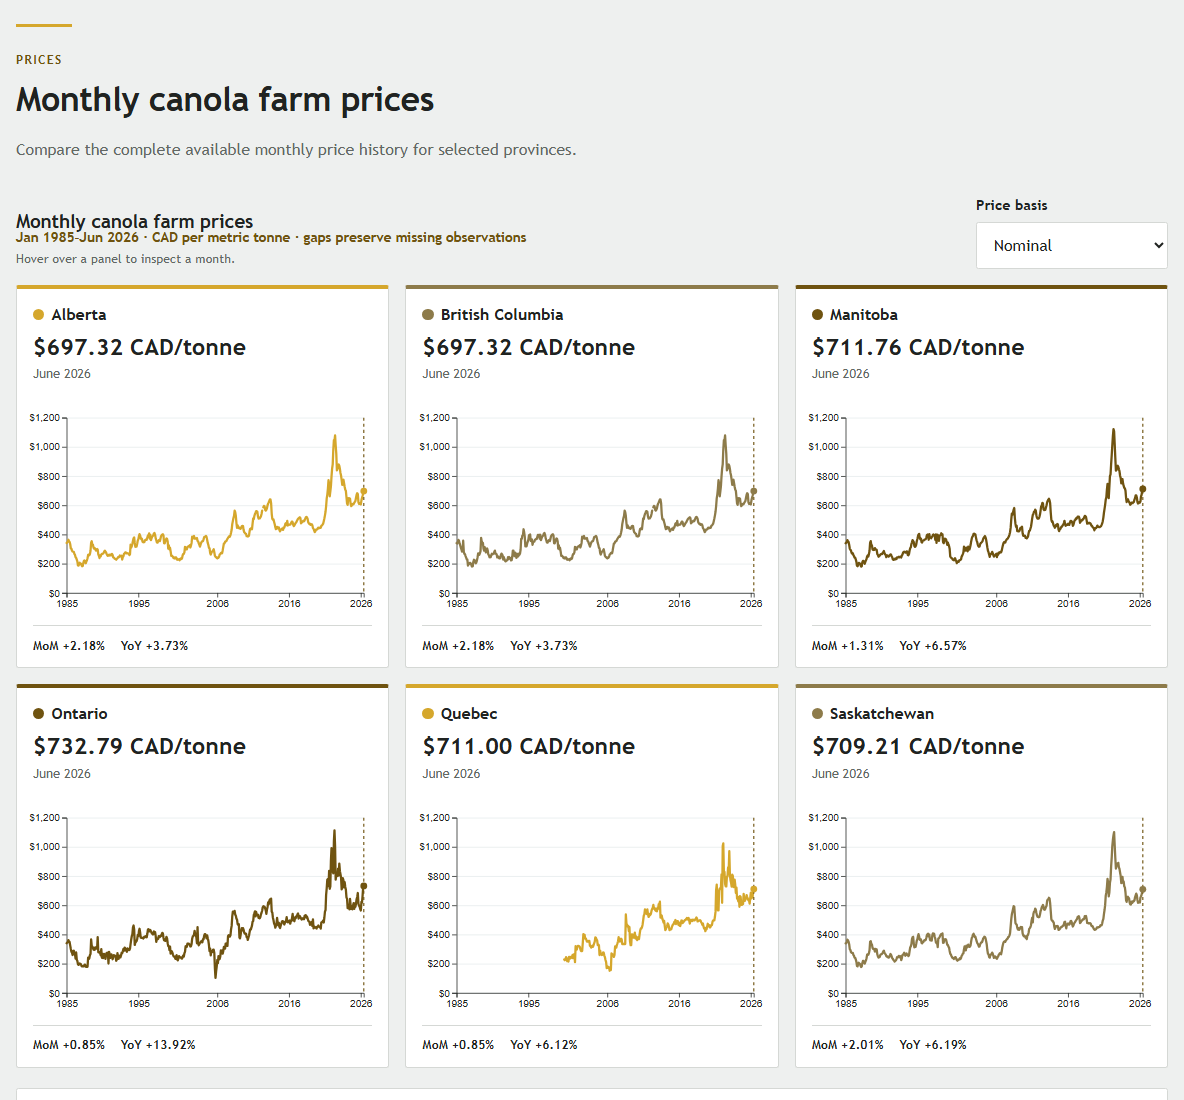
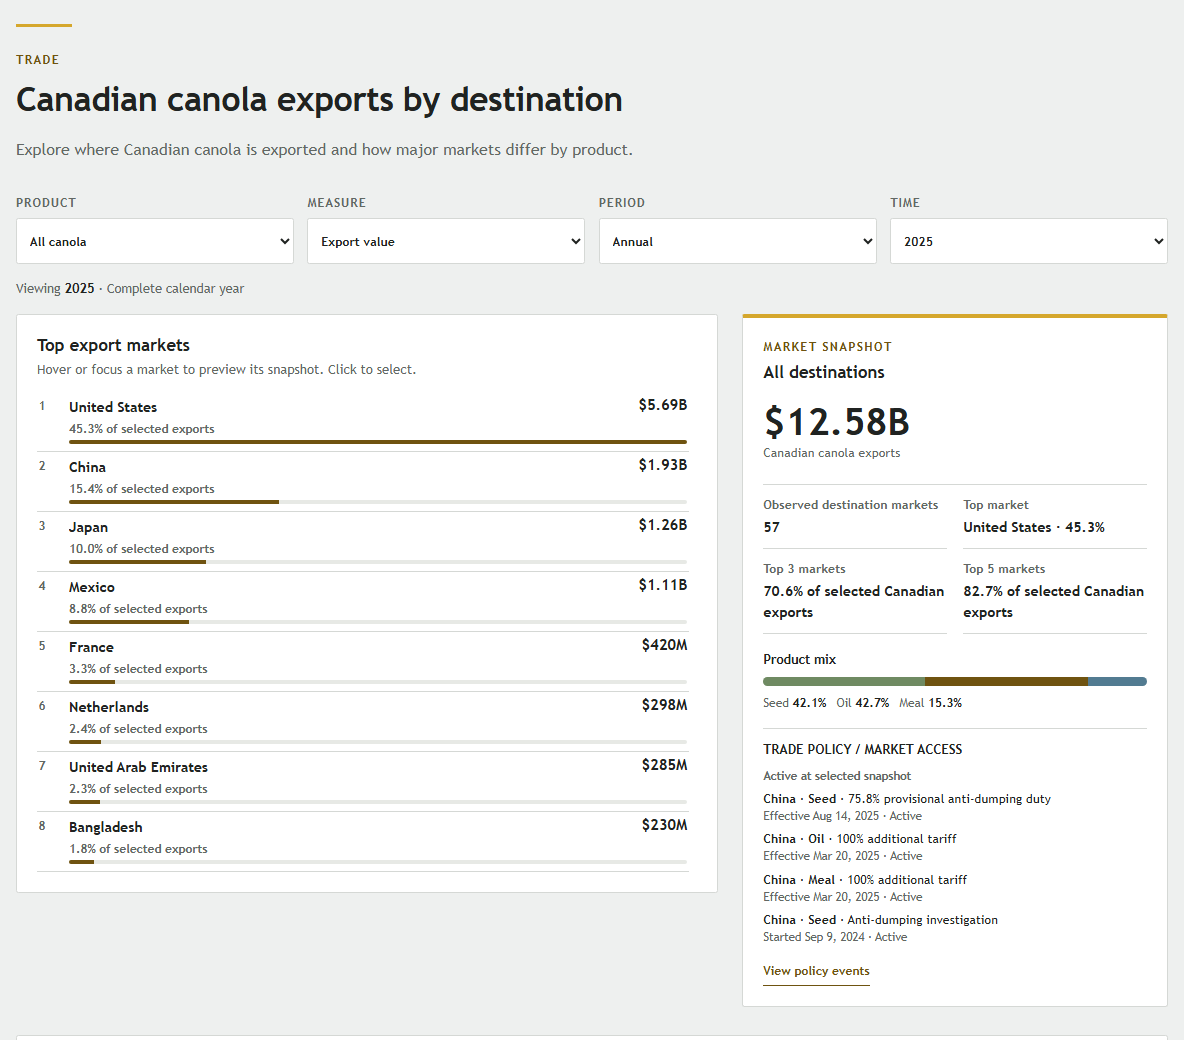
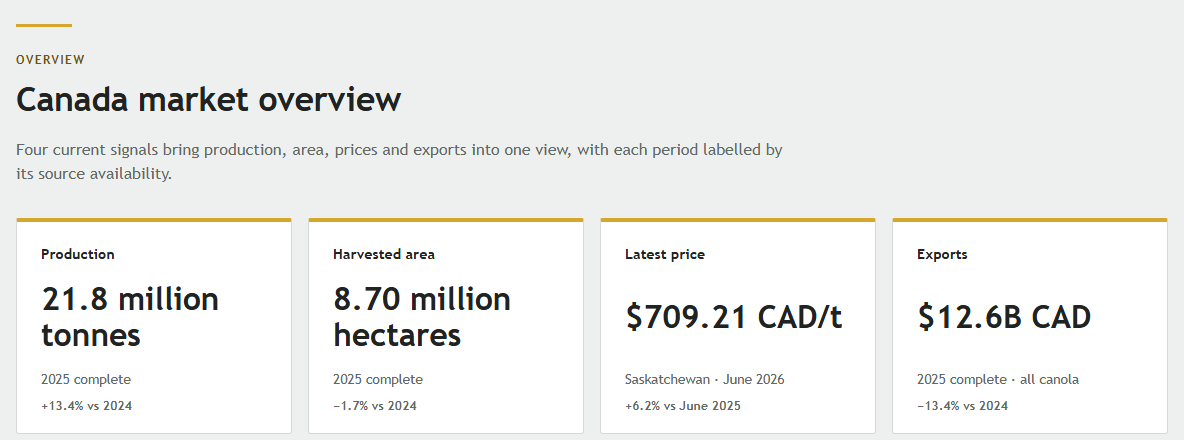
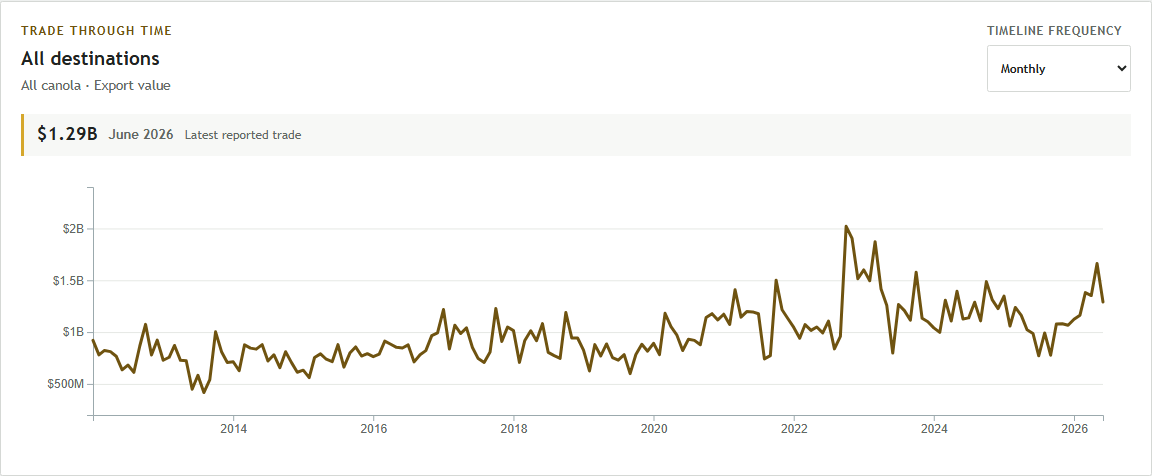
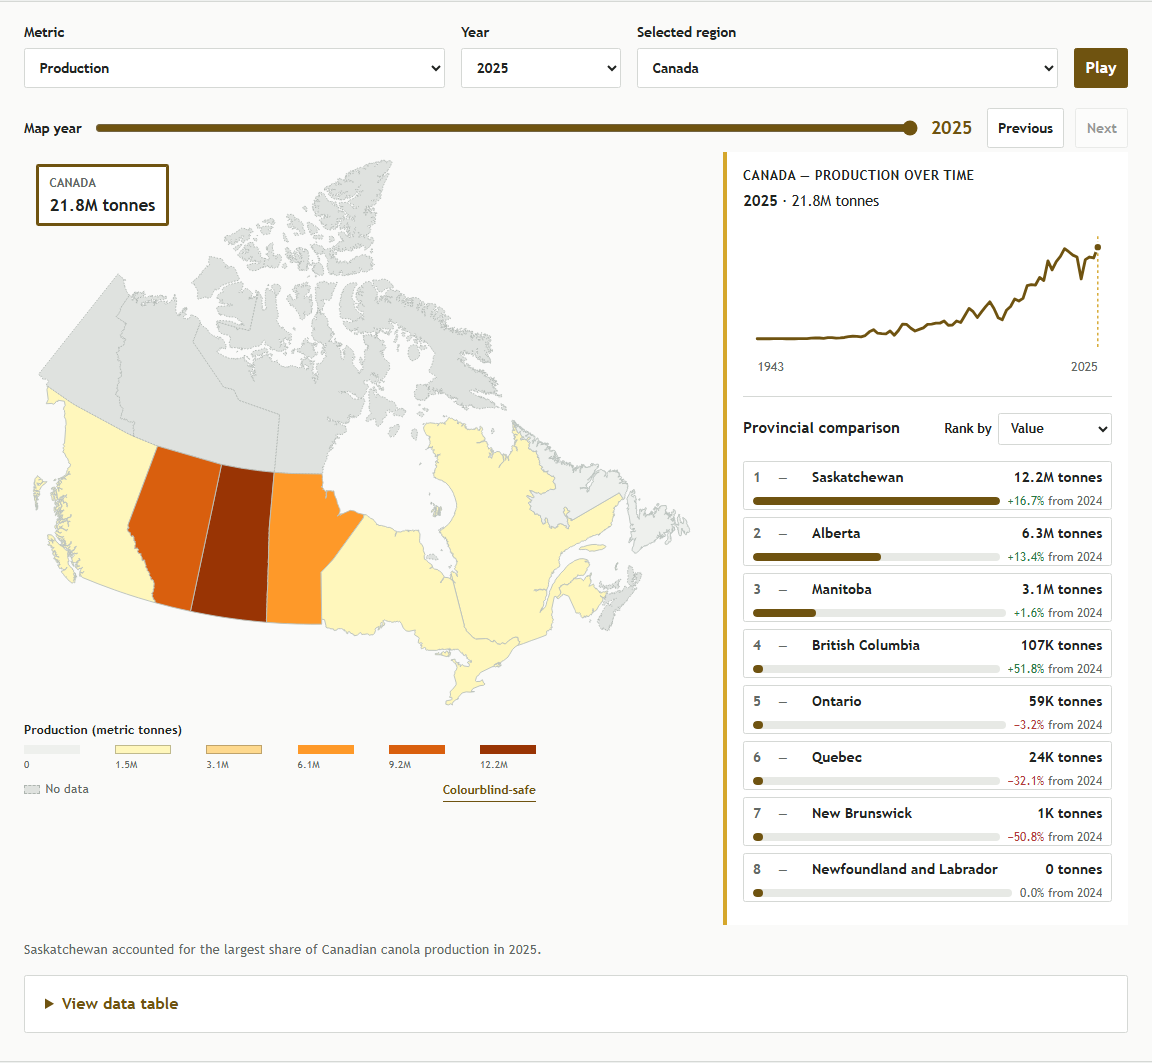
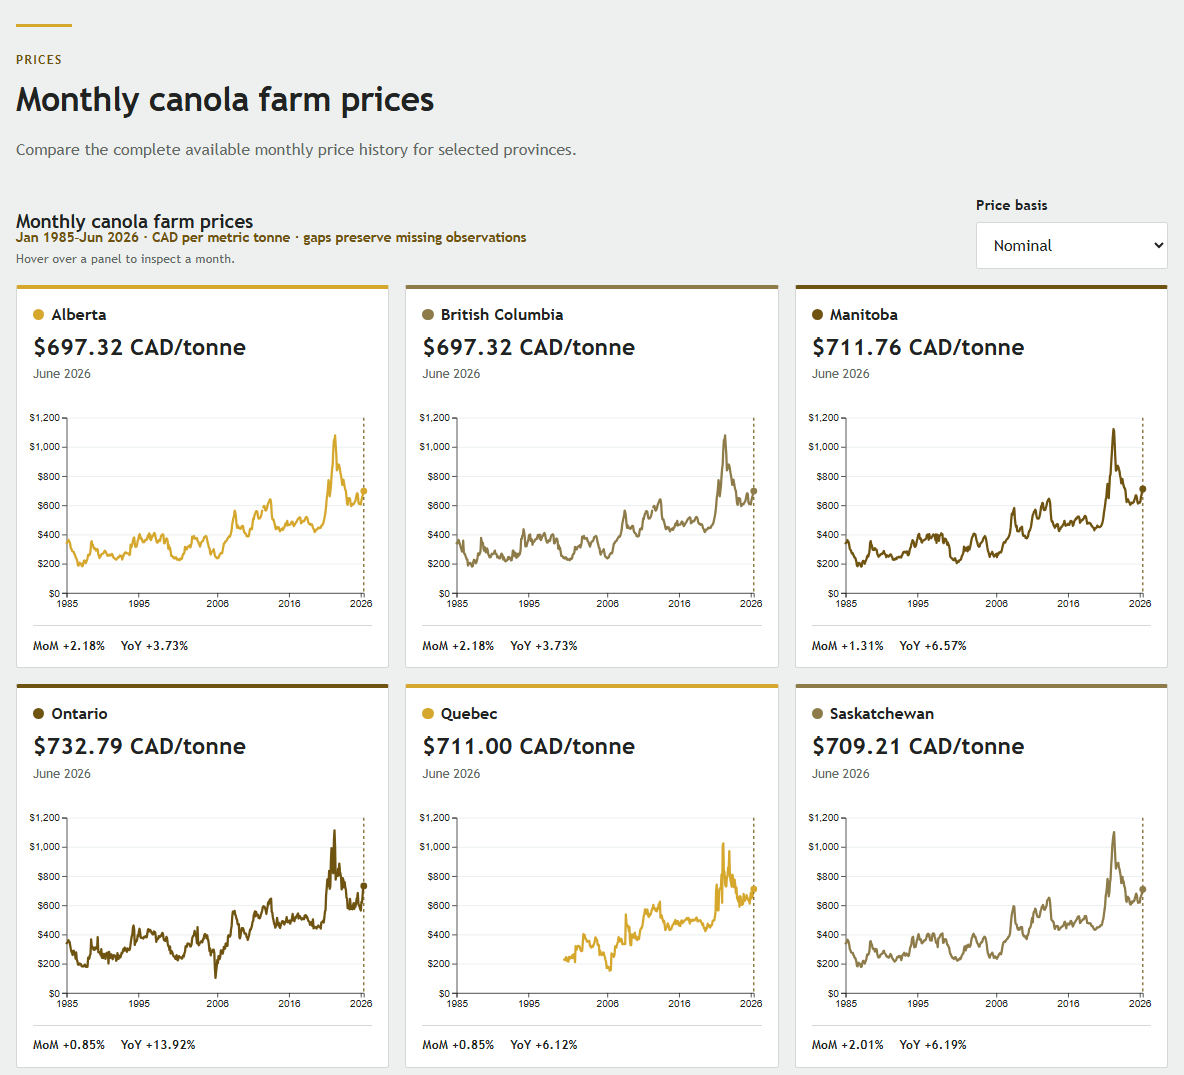
The product combines an overall market view with dedicated sections for production, prices and trade.
Data & methodology
Statistics Canada data are processed into application-ready files rather than queried directly by the interface. Major recurring datasets have documented processing workflows, including source provenance and methodology.
This makes the explorer a product that can be refreshed as new data arrive. It is not a one-off static visualization.
- Production. Annual production, seeded area, harvested area, and yield come from Statistics Canada table 32-10-0359-01 (opens in a new tab).
- Prices. Monthly canola farm prices come from Statistics Canada table 32-10-0077-01 (opens in a new tab).
- Inflation adjustment. Inflation-adjusted prices use Canada’s All-items Consumer Price Index from Statistics Canada table 18-10-0004-01 (opens in a new tab), using June 2026 as the reference period.
- Trade. Export records come from Statistics Canada’s Canadian International Merchandise Trade (CIMT) Web Application (opens in a new tab). Trade events were manually researched from authoritative sources, with provenance retained; they provide context rather than evidence of causation.
Accessibility & responsive design
The experience is built around keyboard-friendly controls, legible responsive charts, and mobile layouts that prioritize the question being answered. Data tables and text alternatives provide access to underlying values where appropriate.
Technology
A focused front-end stack supports the product without becoming the story.
- HTML
- CSS
- JavaScript
- D3.js
- Vite